
Almost every conversation about software cost is a conversation about the build. It is the part with a quote attached, so it is the part that gets compared. It is also the smaller half.
What the research says
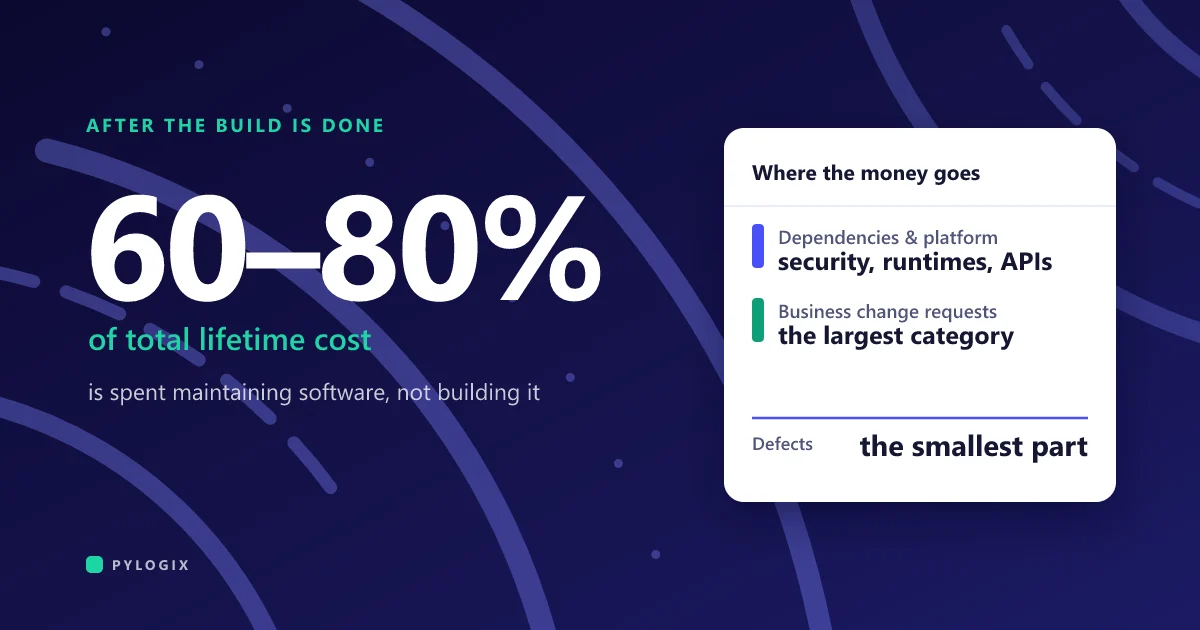
Maintenance as a share of total lifecycle cost is one of the more stable findings in software engineering. The commonly cited range, attributed to the IEEE Computer Society and repeated across decades of literature, is 60% to 80%. Individual studies land across a wider band.
Take the middle of that range and the arithmetic is uncomfortable. If maintenance is 70% of lifetime cost, then a $150,000 build implies roughly $350,000 of maintenance across the system’s life. The quote you compared suppliers on described under a third of the commitment you were making.
Hosting model moves the number materially. Cloud-hosted applications tend toward the lower end of the range, because the platform absorbs work you would otherwise do yourself. Complex on-premises enterprise systems sit at the top of it. If you are choosing between the two, the operating cost difference over five years usually dwarfs the difference in build cost.
Where the money actually goes
The word “maintenance” suggests fixing defects, and that is the smallest part of it.
Keeping dependencies current. Every library your system uses is maintained by somebody else on their schedule. Security patches arrive whether convenient or not. Skip them for two years and you are no longer patching, you are upgrading across breaking changes, which costs several times more.
Platform changes you do not control. Operating systems, language runtimes, cloud services and app stores deprecate things. Mobile is the harshest: two OS releases a year, each capable of breaking something.
Integrations moving underneath you. Every external system you connect to will change its API, its authentication or its rate limits eventually, without asking. The more integrations, the higher the baseline.
Changes the business asks for. The largest category, and the one nobody calls maintenance. Once people use software daily, they want it different. That is a sign of success and it still costs money.
Actual defects. Real, and a minority of the total in a well-built system.
How to budget it
The practical approach is an annual figure expressed as a percentage of build cost, agreed before launch rather than negotiated during the first crisis.
- 15% to 20% a year covers dependency updates, platform compatibility, monitoring and a modest allowance for fixes. This is a keep-the-lights-on figure. It buys you no new features.
- 25% to 35% a year covers the above plus genuine iteration: the changes users ask for once the thing is real. This is what most systems actually need in their first two years.
- Add for each integration. A system talking to six external services carries materially more risk of unplanned work than one talking to none.
Budget the stabilisation window separately. The four to six weeks after launch, when real users find what testing missed and performance behaves differently at real volumes, is not maintenance. It is the last phase of the build, and leaving it out of the budget is one of the reliable ways to overrun. We cover that in why software projects run over budget.
What reduces it, and what only appears to
Things that genuinely lower long-run cost: fewer dependencies, boring and widely-supported technology choices, automated tests that let you upgrade without manual regression, documentation written as you go, and infrastructure defined in code rather than configured by hand.
Things that appear to lower it and do not: skipping tests, deferring documentation, choosing the cheapest build, and picking a novel framework because it is faster to start in. Each converts a known capital cost into a larger and less predictable operating cost, usually within eighteen months.
The single highest-leverage decision is who can maintain it. A system only its original authors understand carries a hidden premium forever. Insist on documentation good enough for another team to take over, source code in a repository you own, and infrastructure in your accounts. Agree that at the start, when you have leverage, not later when you do not. Our checklist on choosing a development partner covers what to get in writing.
What we do
We quote maintenance as an annual figure alongside the build, so the comparison you make is the real one rather than a third of it. Code, infrastructure and documentation are yours throughout, and the handover is a deliverable rather than a favour. There is more on the delivery model on our custom software development page, and on where build budget goes in what custom software actually costs.
If you have a system already running and no idea what it should be costing to keep, tell us what you have.
Common questions
What percentage of software cost is maintenance?
Research consistently puts maintenance at 60% to 80% of total lifecycle cost, with individual studies ranging from 67% to over 90%. Cloud-hosted applications tend toward the lower end and complex on-premises systems toward the higher.
How much should we budget annually for software maintenance?
As a share of build cost: 15% to 20% a year keeps the system patched, compatible and monitored with no new features. 25% to 35% covers that plus the changes users ask for once the software is real, which is what most systems need in their first two years. Add for every external integration.
Is maintenance mostly bug fixing?
No. Defects are usually the smallest part. Most of the cost is dependency and security updates, platform changes you do not control, external APIs changing underneath you, and business-requested changes once people use the system daily.
Sources
- The 60% to 80% range for maintenance as a share of total software lifecycle cost is attributed to the IEEE Computer Society and is widely repeated in the software engineering literature.
- Individual estimates as commonly cited: Schach (1999) 67%, Pigoski (2001) over 80%, Erlikh (2015) over 90%, Galorath (2022) 75%. These are secondary citations rather than figures we have verified against the original papers, so they are given for direction rather than precision.
- Hosting model comparison: cloud-based applications commonly cited at the lower end of the range, complex on-premises enterprise software at the higher end.
Figures were current at the time of writing (September 2026).