
Software projects rarely fail suddenly. They drift, and the drift is visible for weeks before anyone uses the word overrun. By the time it reaches a steering meeting the cheap options have gone.
This is what the research says about how often it happens, then the signals that show up early and what to do about each one.
How common this actually is
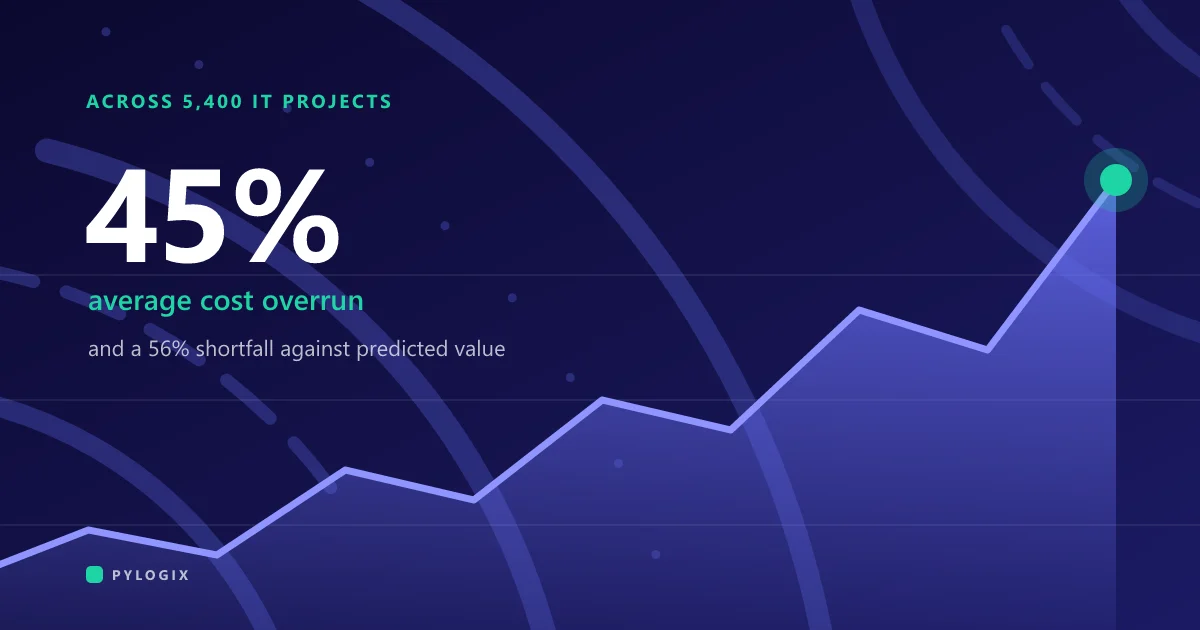
The largest study on the subject remains McKinsey’s work with the University of Oxford, covering more than 5,400 IT projects. It found large IT projects run 45% over budget and 7% over schedule on average, while delivering 56% less value than predicted.
Two conclusions follow, and they matter more than any estimate a supplier can give you.
A contingency of ten percent is not a contingency. If the average overrun is 45%, a plan with no room to move assumes you will beat the average comfortably, on your first attempt, with a supplier you have not worked with before.
And the thing everybody watches is not the thing that goes wrong most. Projects fail to pay for themselves more often than they fail to land on budget. A build delivered at cost that nobody uses is the more common failure, and it is the one nobody is tracking.
The same research found that 17% of projects went so far over, in the range of 200 to 400%, that they threatened the organisation running them. Those were concentrated in projects with infrequent checkpoints, where a quarterly review meant three months could pass before anyone noticed the project was off track.
The seven signals
Ask how far through the build you are. If the answer is a confident “about seventy percent” every week for a month, that number is a feeling rather than a measurement.
Progress counted in features started hides an accumulating pile of nearly-finished work. The last tenth of each item is where testing, edge cases and integration live, and it is most of the remaining effort.
What to do: change the unit. Count only work deployed to an environment you can open and accepted by someone who is not the developer. The number will drop, possibly a lot. That drop is information.
Easy to miss, because the demo looks good. If you see interfaces but never watch data travel through a whole process end to end, you are seeing progress on the visible layer only.
Interface work is fast. Integration work is slow. A project can look nearly finished while none of the genuinely hard work has been attempted.
What to do: ask for one complete journey working end to end, with real data, against real integrations, however ugly it looks. If that cannot be shown by a third of the way in, the schedule is at risk whatever the plan says.
Ask which external systems have been connected and proven. If anything central is still “we will do that later”, the largest risk in the project has not been looked at.
Integrations fail in ways nobody plans for. The sandbox does not match production. The rate limit is lower than the documentation says. Access needs approval from a team with its own timetable. None of that is solved by coding faster.
What to do: move integration work to the front, even in rough form. Proving the connection is the point, not finishing the feature that depends on it. A proper discovery phase exists to settle this before a build starts.
Track how long questions from the team stay open. An average above two or three working days is probably already your most expensive problem, and it sits on your side of the table.
A blocked team either waits, which you pay for, or assumes, which you pay for later when the assumption turns out wrong.
What to do: name one person with authority to decide and give them a standing slot with the team. Reduce how many people must approve things. This costs nothing and shortens projects more reliably than any technical intervention.
Not the occasional addition, which is normal and healthy. The pattern where every conversation adds something and the list only ever gets longer.
Each addition is small and reasonable on its own. Collectively they are the overrun. Teams rarely refuse them because refusing something that sounds trivial looks unhelpful.
What to do: keep one visible list and require every addition to name what it displaces or what it costs in time. Not to block changes, but to make the trade-off explicit when it is made rather than at the end.
Count open defects weekly. A line trending upward three weeks running means quality is being deferred, and deferred quality accrues interest.
It usually means the team is being pushed to hit dates by moving on before work is genuinely finished. The project keeps looking on schedule right up until a stabilisation phase appears that nobody budgeted.
What to do: stop adding features until the trend reverses. This feels like losing time and is almost always faster, because defects found near release cost far more than the same defects found in the week they were written.
If you are four weeks out and there is no plan for the first month in production, the budget is going to be exceeded even if the build itself lands perfectly.
Real users find what testing missed. Performance behaves differently at real volumes. Data arrives in shapes nobody anticipated. That is the normal condition of shipped software and it takes four to six weeks of real effort.
What to do: budget the stabilisation period explicitly and agree who is available and how quickly. Left unbudgeted, it gets taken from whatever comes next.
The pattern underneath all seven
Every one of these is the same thing in different clothing: risk being deferred instead of retired. The easy work goes first because it produces visible progress, and the uncertain work piles up at the end, where there is no budget or time left to absorb it.
The single most effective correction is to reverse the order. Do the frightening parts first, while the budget still has room to react to what you learn. It makes the early weeks look slower and the project finish sooner.
The second is to make estimates honest. A single number presented as a commitment is a forecast in disguise. A range with written assumptions lets everyone see which assumption broke when something moves, which turns an argument into a conversation. There is more on that in what custom software actually costs, and on evaluating suppliers in choosing a development partner.
Smaller projects succeed far more often than large ones. That is the most consistent finding across decades of project research, and it is the one lever almost always available: cut the first release down to something that can be finished, shipped and learned from, then decide what comes next with real information instead of a plan written before anyone had any.
If you are already over
Do not start by asking for more people. Adding developers to a late project reliably makes it later, because the existing team loses time explaining context to the new ones.
Start by cutting scope to what must exist for the thing to be useful at all, and be honest about which features were aspirational. Then fix the process problem that caused the drift, usually decision latency or deferred integration work. Then, if it is still needed, talk about budget. In that order.
If you want an outside read on a project that is drifting, tell us where it stands. A short assessment costs considerably less than another quarter on the same trajectory.
Common questions
How much do software projects typically go over budget?
Across more than 5,400 IT projects studied by McKinsey with the University of Oxford, large IT projects ran 45% over budget and 7% over schedule on average, while delivering 56% less value than predicted. A further 17% overran by 200 to 400%, enough to threaten the organisation running them.
What is a realistic contingency for a software budget?
More than the ten percent most plans carry. Given a 45% average overrun, fifteen to twenty percent is realistic for a well-scoped build, and more where integrations or data migration are involved.
What is the earliest warning sign of an overrun?
Usually decision latency on the client side. If questions from the team stay open for more than two or three working days, the team is either idle or building on assumptions, and both get paid for later. It is also the cheapest signal to fix.
Sources
- McKinsey & Company with the University of Oxford, Delivering large-scale IT projects on time, on budget, and on value. More than 5,400 IT projects: 45% average cost overrun, 7% schedule overrun, 56% less value than predicted. 17% overran by 200 to 400%.
- The Standish Group CHAOS research has reported for three decades that small projects succeed at far higher rates than large ones. Its methodology has been contested in the academic literature, so it is cited here for the direction of the finding rather than for precise percentages.
Figures were current at the time of writing (September 2026).