
Data pipelines and warehouses your team can trust
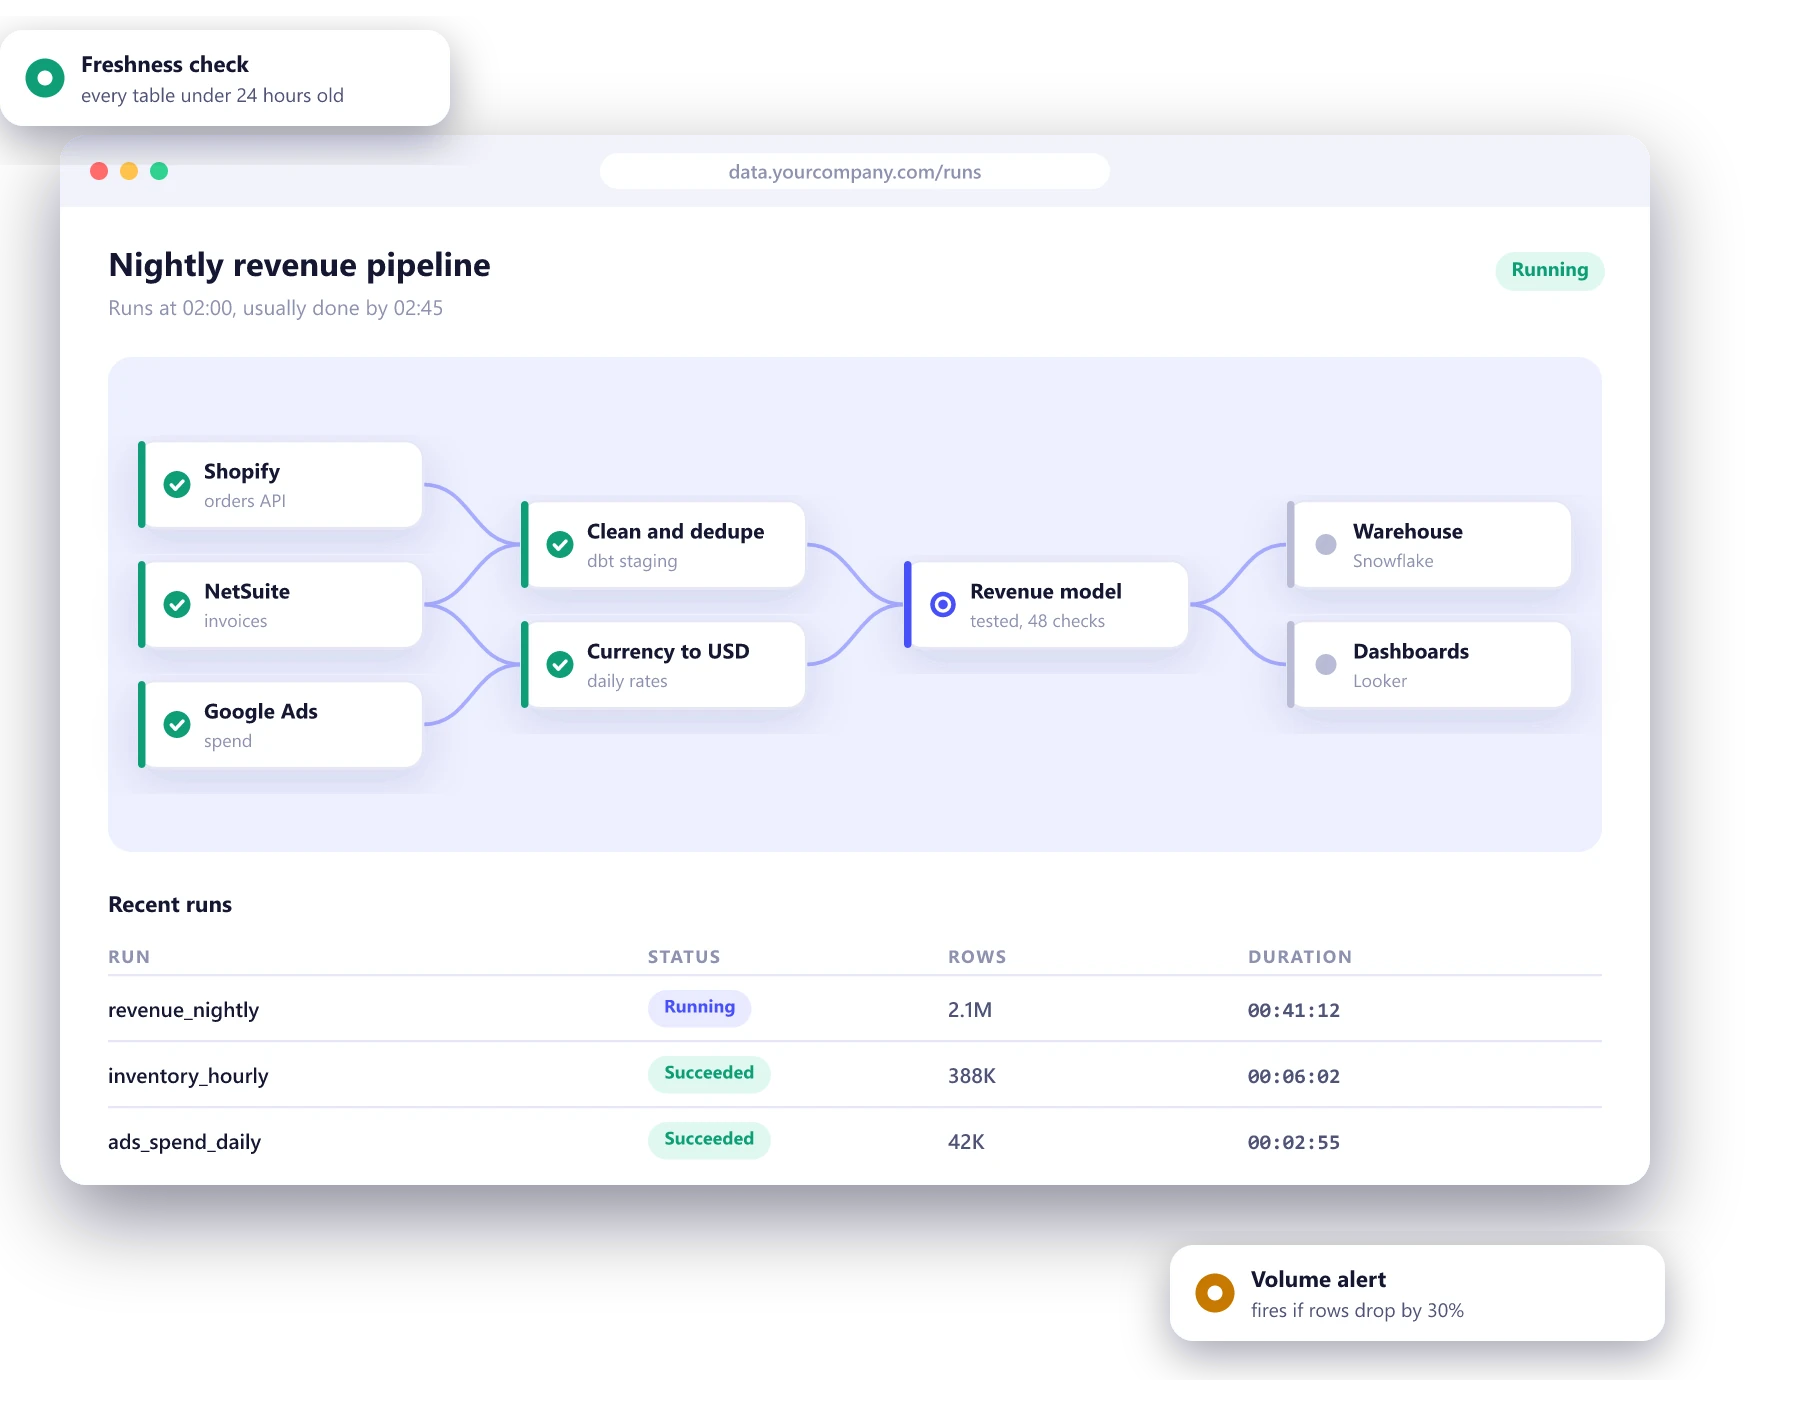
When sales, finance and operations bring different numbers to the same meeting, the problem is usually the plumbing. We build pipelines that pull data from every system you run, model it once with tests, and publish dashboards everyone agrees on.
- Every model tested
- Freshness alerts on every table
- One agreed definition per metric
Signs your data needs engineering
Everyone has their own spreadsheet
Each team exports, cleans and combines data its own way, so the same question gets three answers.
Reports take days
Someone spends the first week of every month assembling numbers that should be ready on the first morning.
Nobody trusts the dashboard
A dashboard was built once, broke quietly when a source changed, and people stopped using it.
AI plans are stuck on data
The machine learning project cannot start because the data it needs is scattered, messy or undocumented.
A modern data stack, sized for you
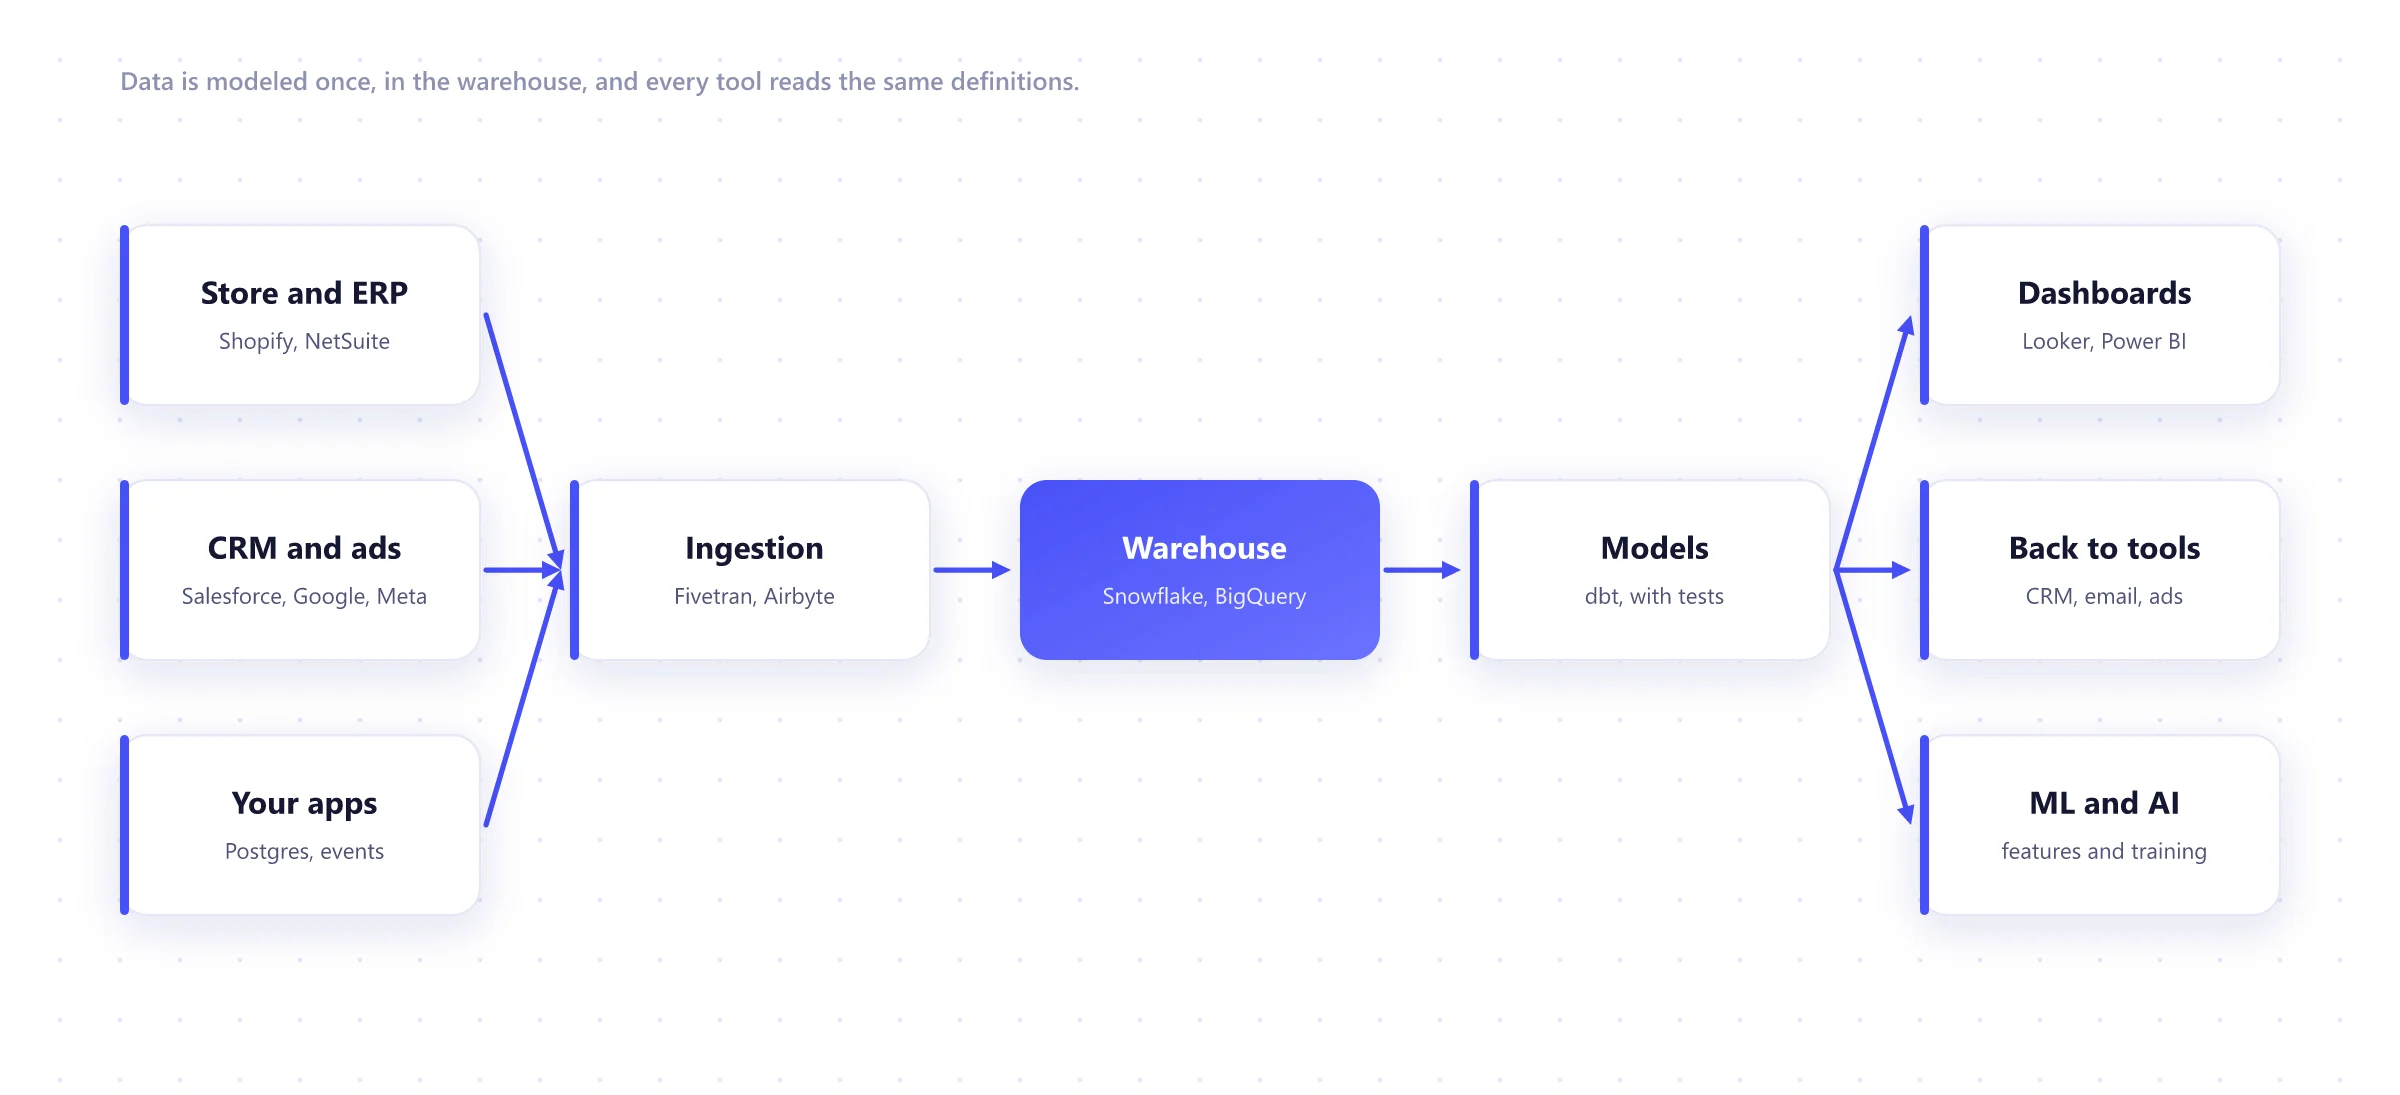
Sources flow into a warehouse through managed ingestion, business logic lives in tested models, and every dashboard, report and AI feature reads from the same place.
Data engineering work we take on
Pipelines and ingestion
Data pulled from your store, ERP, CRM, ad platforms and apps on a schedule or in near real time.
Warehouse setup
Snowflake, BigQuery, Redshift or PostgreSQL set up with access controls, budgets and sensible costs.
Data modeling
dbt models that turn raw tables into clean, documented facts like orders, customers and revenue.
Dashboards and reporting
Dashboards in Looker, Power BI or Metabase that answer the questions your teams actually ask each week.
Data quality
Tests, freshness checks and volume alerts, so problems are caught before a report goes out.
Data for machine learning
Clean, versioned datasets and features ready for forecasting, classification and AI projects.
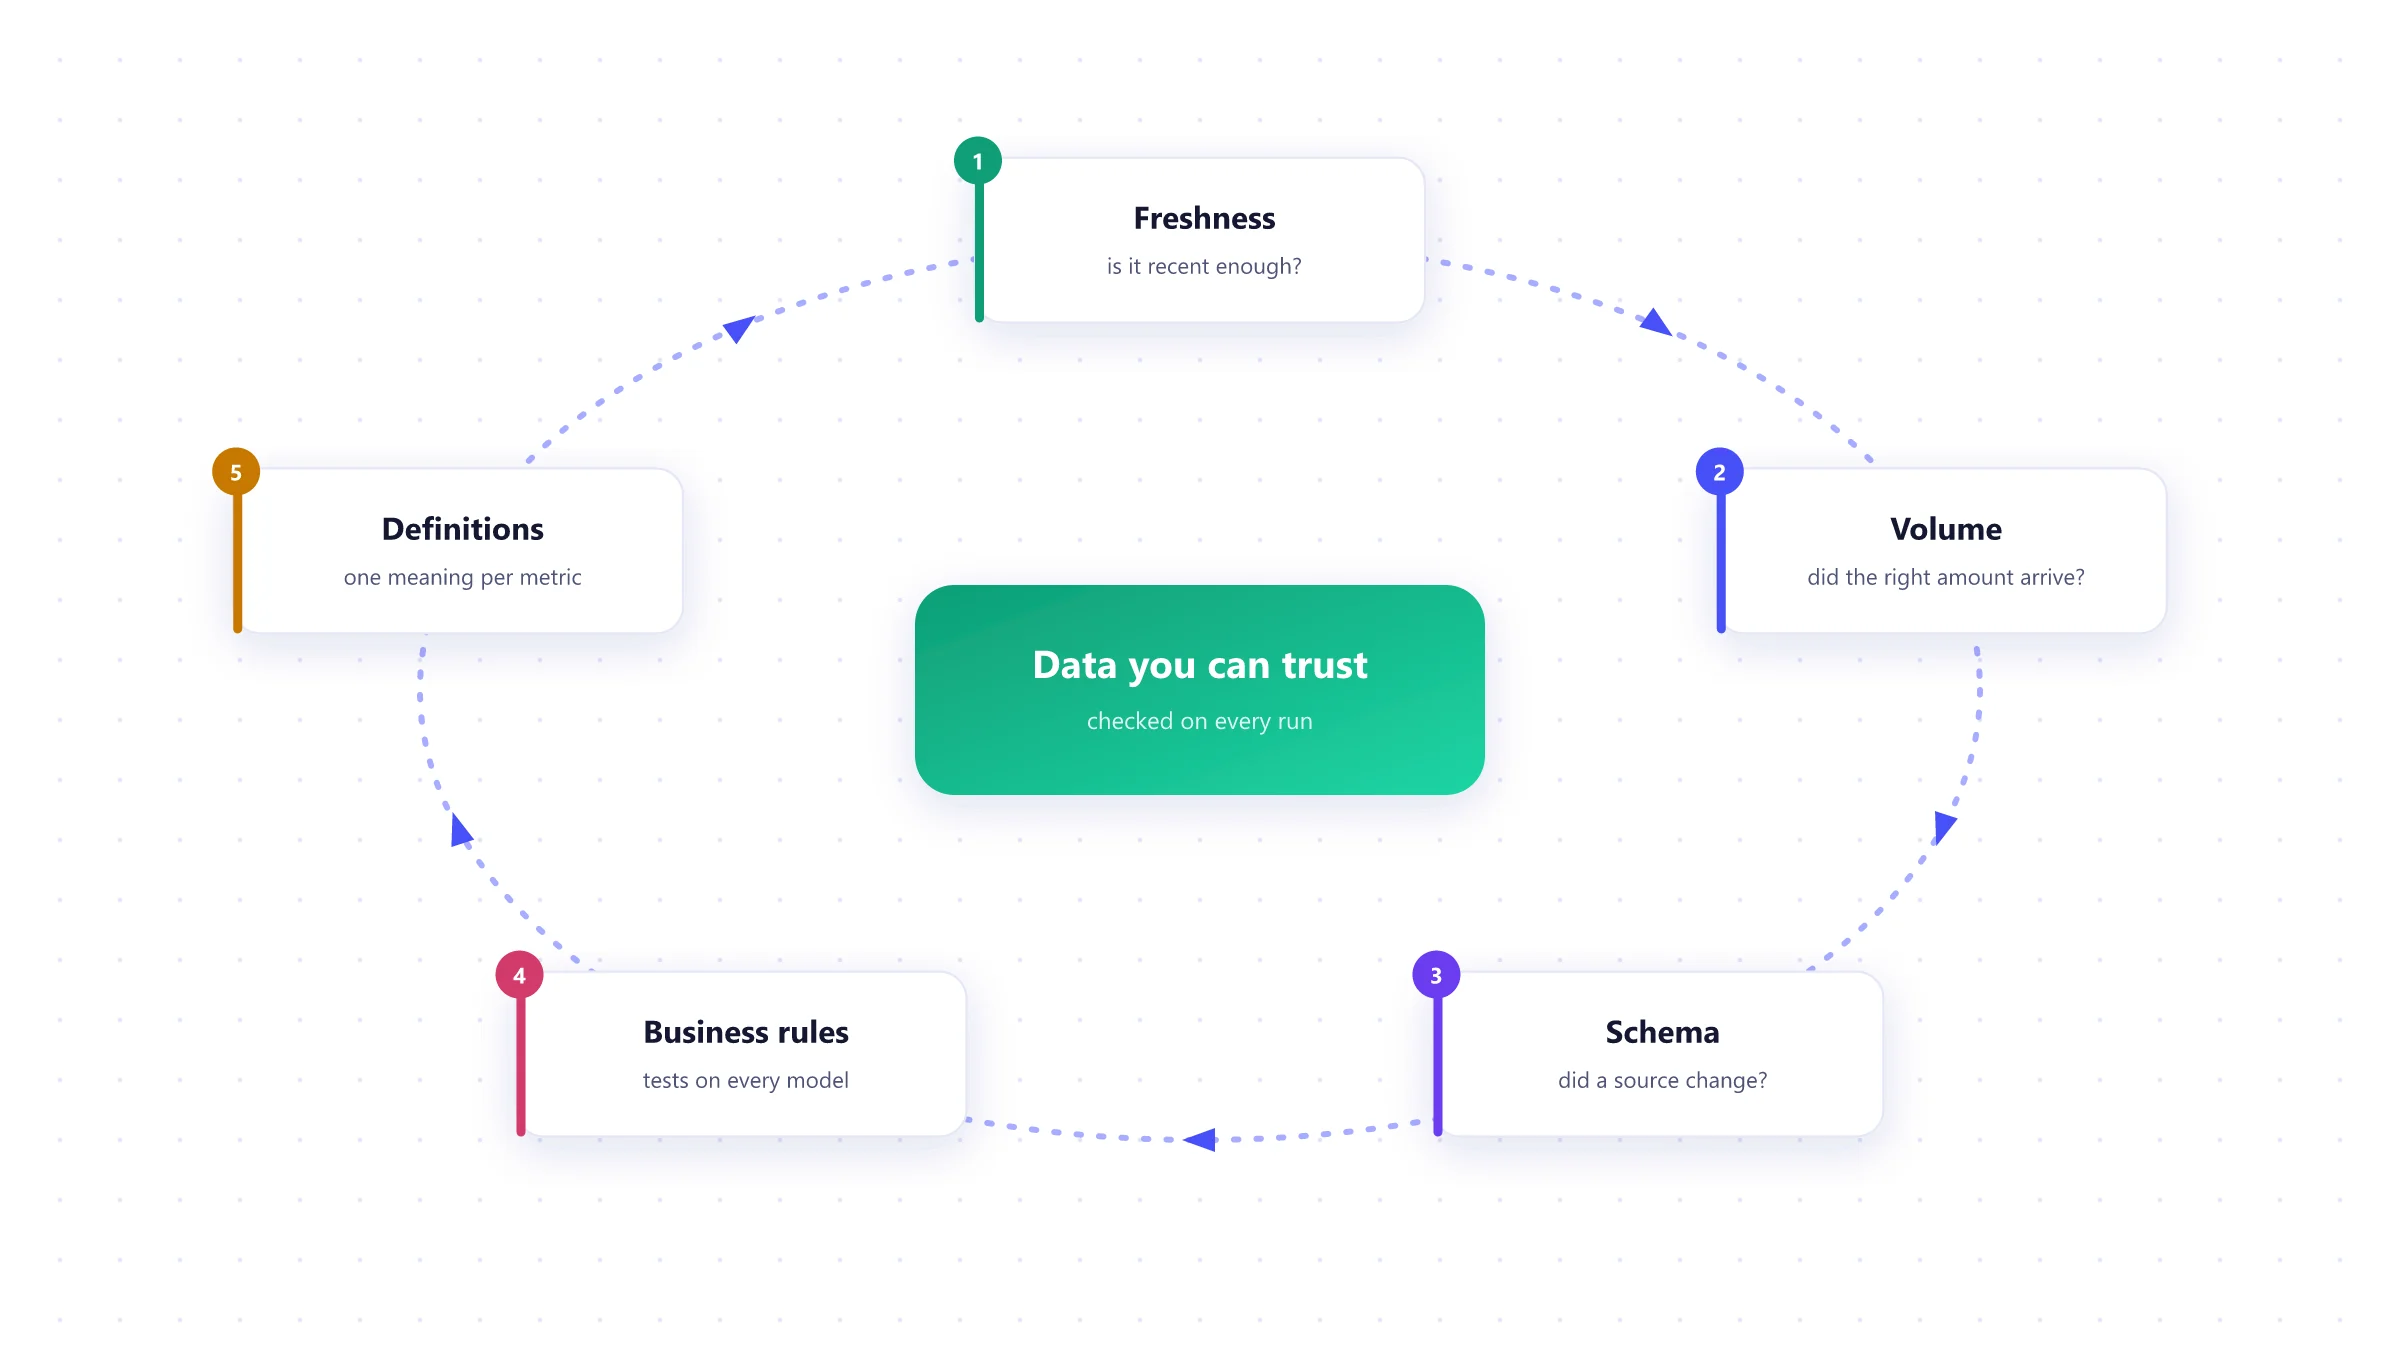
Is your data ready? →Five checks on every run
Pipelines fail in quiet ways: a source renames a column, a sync half-finishes, a tax rule changes. We check for each of these automatically and alert a person before the numbers reach a meeting.
One subject area at a time
Audit
1 to 2 weeksSources, reports, definitions and pain points mapped. A first subject area chosen.
Foundations
2 to 3 weeksWarehouse, ingestion, access and cost controls set up.
First area
4 to 6 weeksModels, tests and a dashboard for one area, usually revenue or operations.
Expand
In stagesThe next areas, reusing the same foundations and definitions.
Operate
OngoingMonitoring, new sources and new questions as the business changes.
Data and reporting work
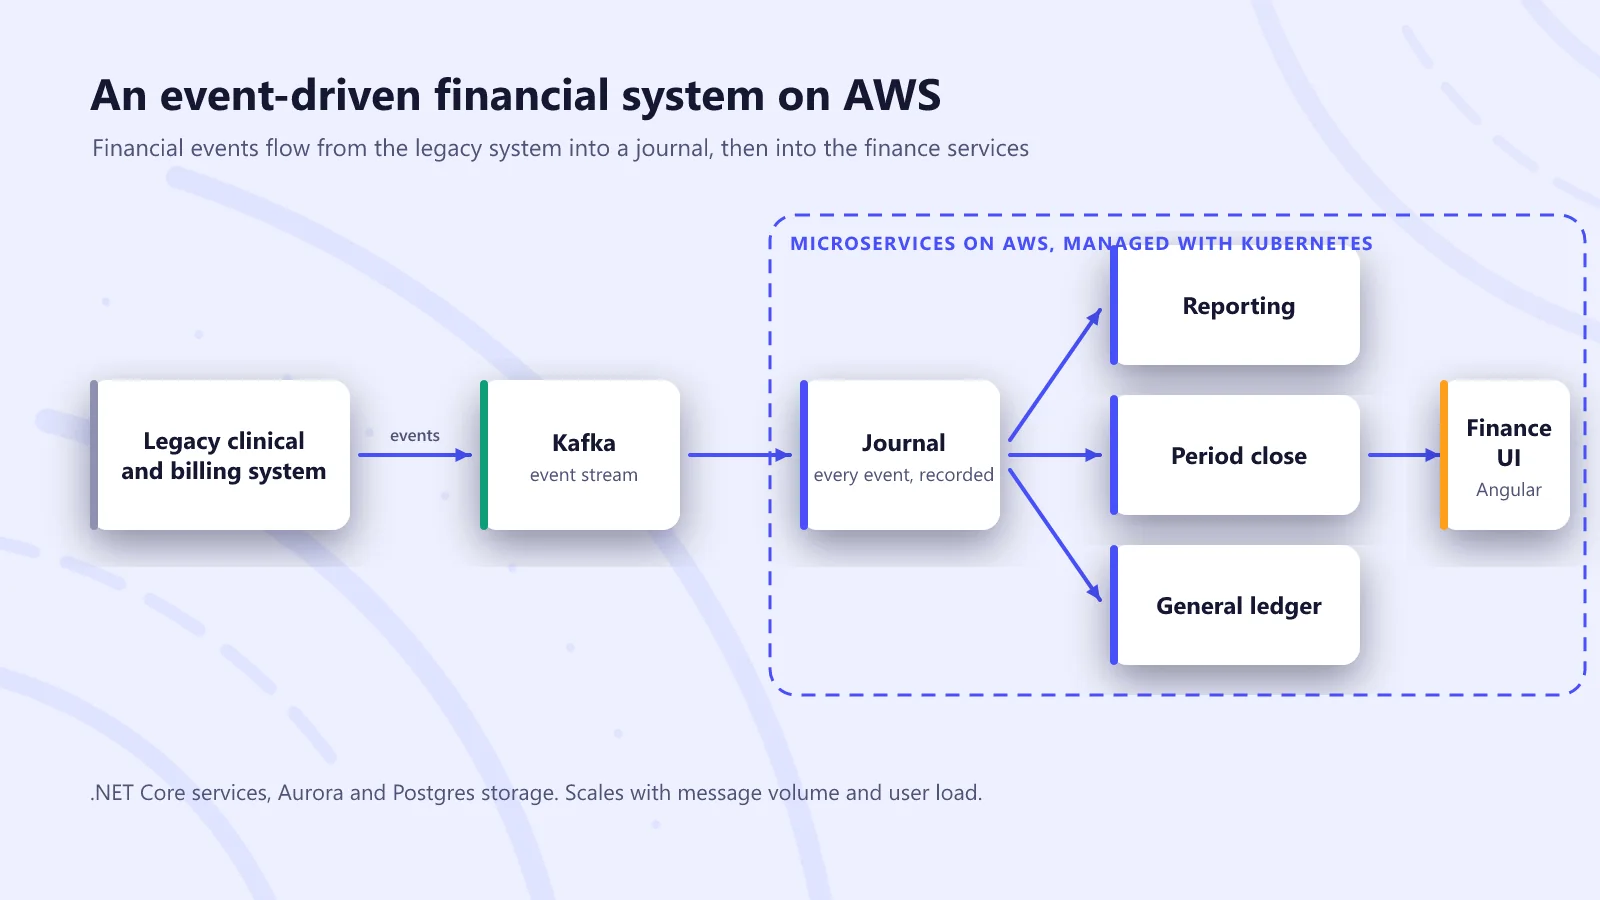
A financial system rebuilt for new CMS payment rules
An event-driven finance platform for a home health and hospice provider, delivered to a fixed regulatory deadline while the rules were still being clarified.
Read the case study →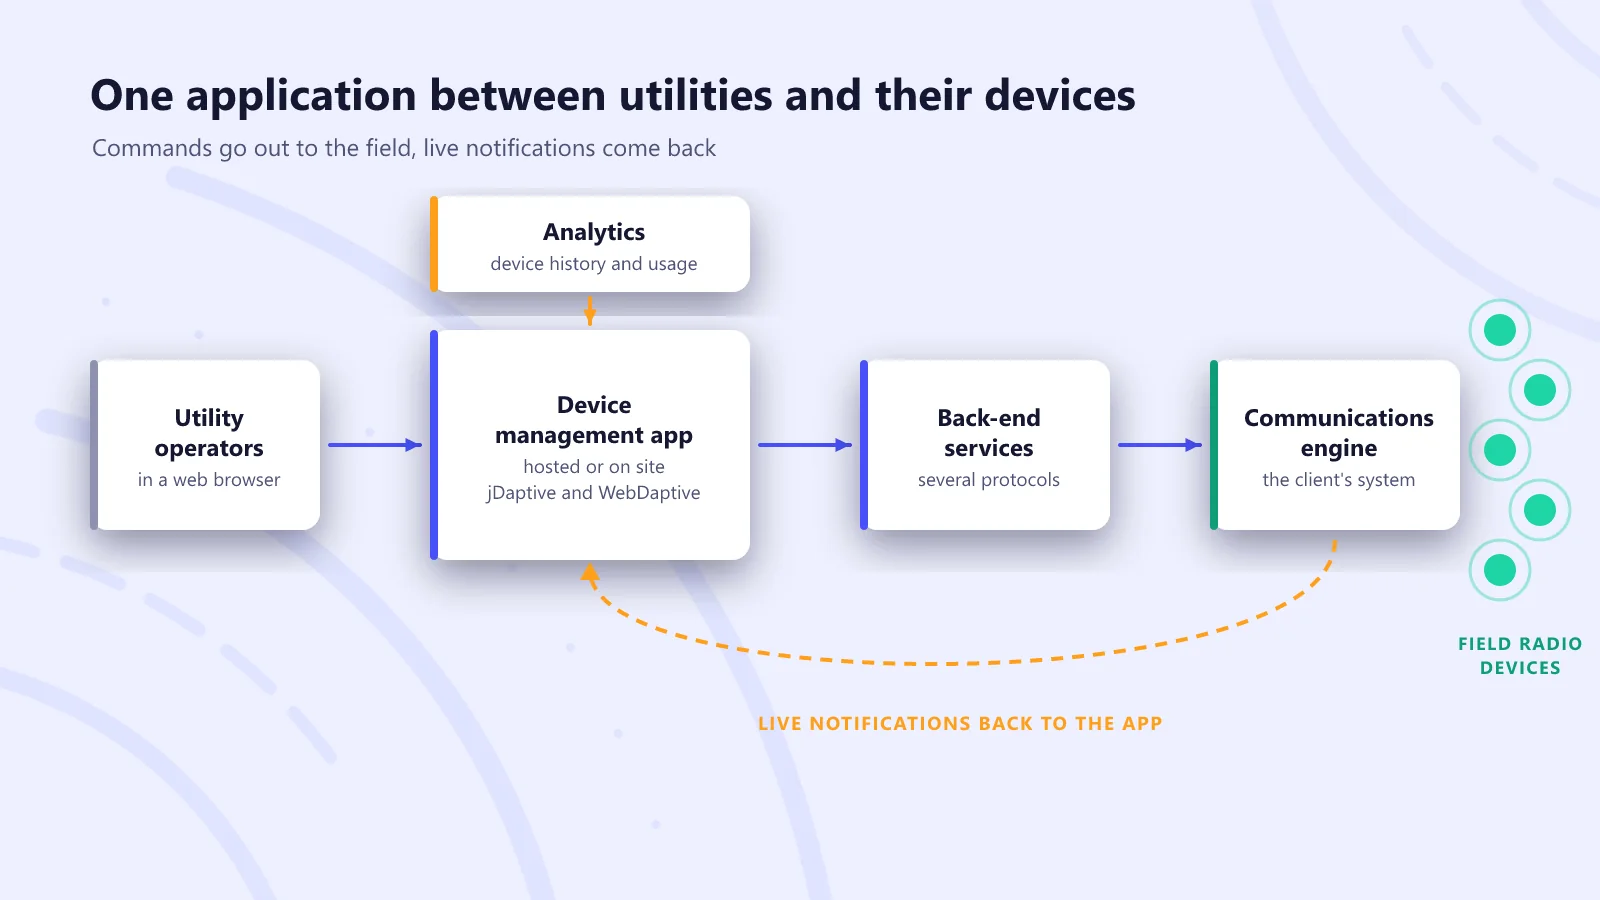
Remote management for utility field devices
A central web application that lets water and energy utilities change settings on their radio devices, or upgrade a whole territory, without a site visit.
Read the case study →
Simmons, selling direct for the first time
After 150 years of selling through retailers, a direct-to-consumer store on Shopify Plus connected to the ERP behind every Serta Simmons brand.
Read the case study →What we build data platforms with
Warehouses
- Snowflake
- BigQuery
- Redshift
- PostgreSQL
Ingestion
- Fivetran
- Airbyte
- Kafka
- Custom connectors
Transformation
- dbt
- SQL
- Python
- Spark
Orchestration
- Airflow
- Dagster
- dbt Cloud
BI
- Looker
- Power BI
- Metabase
- Tableau
Quality
- dbt tests
- Great Expectations
- Elementary
Data engineering FAQ
Do we need a data warehouse?
If people regularly combine data from more than two systems in spreadsheets, or reports take days to produce, usually yes. If your questions can be answered inside one system, its own reporting may be enough for now, and we will say so.
Snowflake, BigQuery or something else?
All the major warehouses are good. BigQuery suits teams already on Google Cloud, Snowflake works well across clouds, Redshift fits AWS-heavy setups, and PostgreSQL is often enough for smaller volumes. We choose from your cloud, your volume and your budget.
How long until we have a first dashboard we can trust?
Usually six to eight weeks for one subject area, such as revenue, including ingestion, modeling, tests and the dashboard. Each new area after that is quicker because the foundations are in place.
What does it cost to run?
Warehouse and ingestion costs depend on volume and how often data refreshes. We estimate the monthly running cost up front, set budgets and alerts, and design models so they do not rescan data they do not need to.
Can you work with our existing Power BI or Looker?
Yes. We usually keep the BI tool your team knows and fix what sits underneath it, so the numbers in the dashboards finally agree with each other.
How do you handle personal and sensitive data?
Access is granted by role, sensitive columns are masked or excluded, and we keep only what you need. We set up audit logs and retention rules that match your compliance requirements.
Worth reading before you start
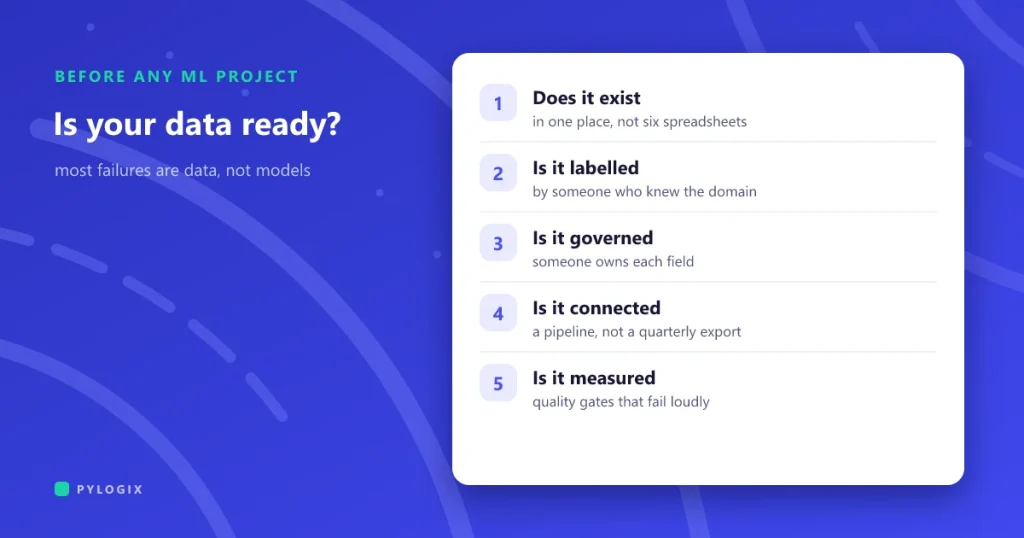 Is your data ready for machine learning?
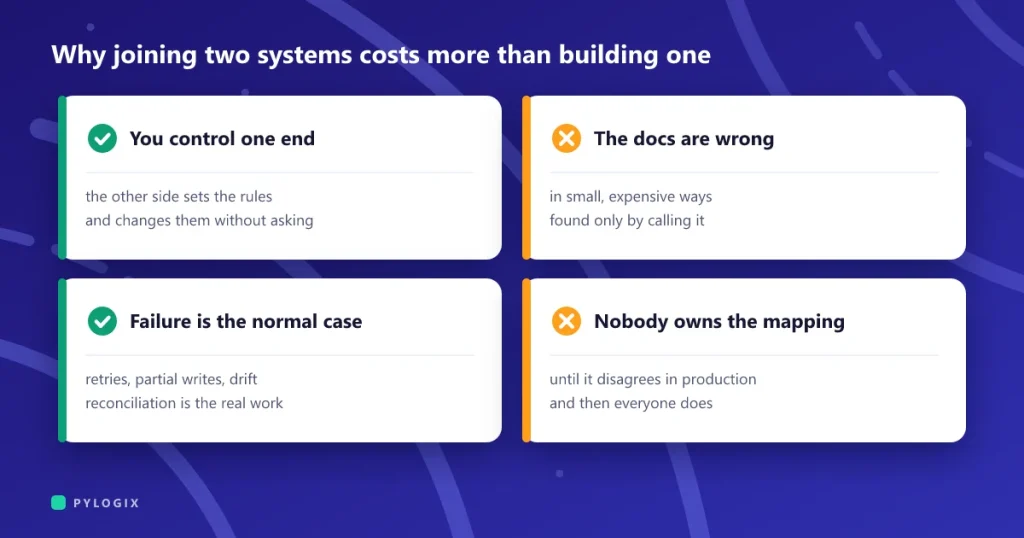 Why connecting two systems costs more than building one
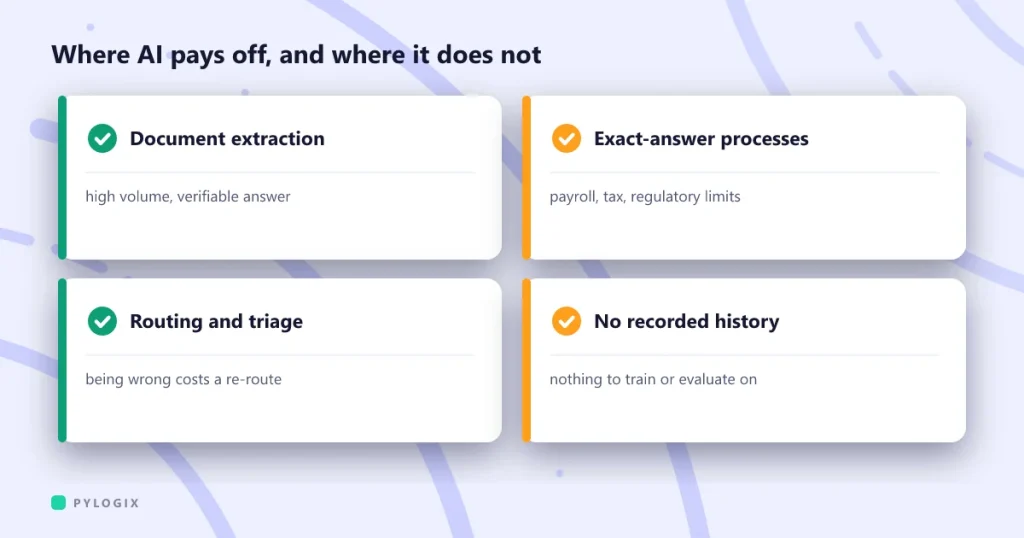 Where AI actually pays off in business software
Which numbers does your team argue about?
Tell us the reports that take too long or never agree. We will suggest where the data should live and what a first subject area would look like.